There are many times when we would like to analyze data, but we may question if we have the skills to do it. We will illustrate a few simple steps to make your reporting or analysis needs a reality using Excel and a few simple formulas and features.
Using the Transaction Pro Export utility, you can choose the data you want to export to create reports for all your needs.
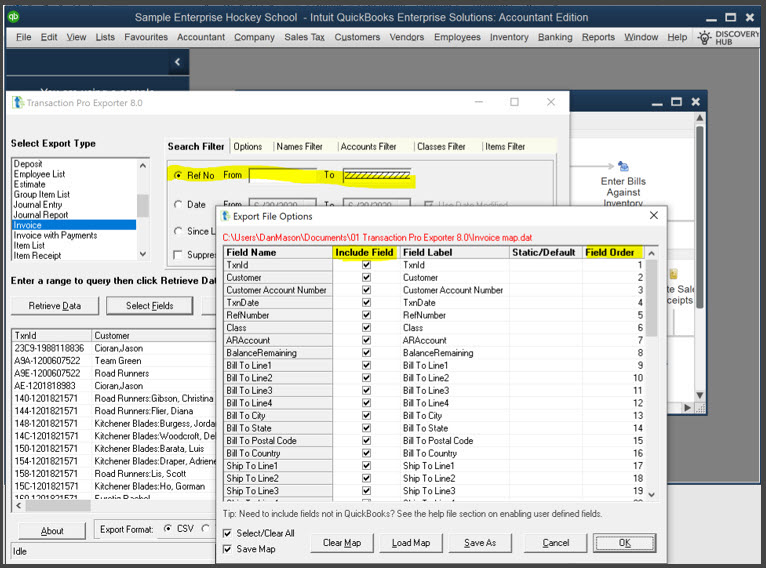
In QuickBooks Desktop, we can use Transaction Pro Exporter to Select the Export Type and then select the fields and define the order in which you would like to see the data presented. You can even change the names of the fields or assign static values to the field data as shown below.
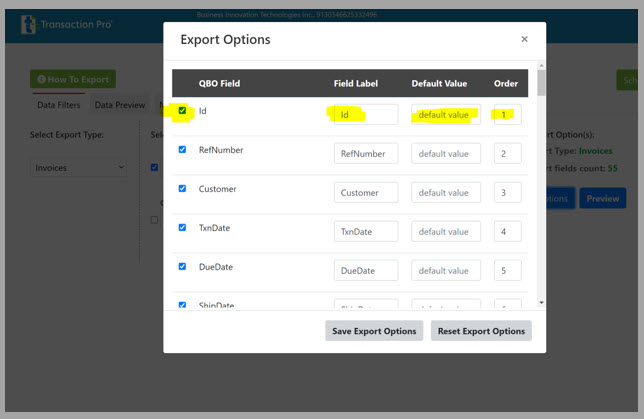
In Quickbooks Online, the same functionality is available in a simple web-based layout as shown in the illustration below.
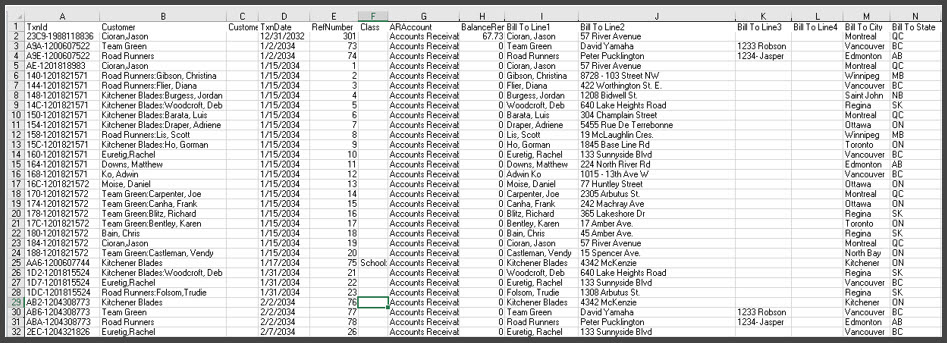
All the data that you have selected will create an SQL query that will allow you to export your data into an Excel worksheet as shown below. You can take a raw data export like this and use it with many Excel functions to present your data in a graphical or tabular layout.
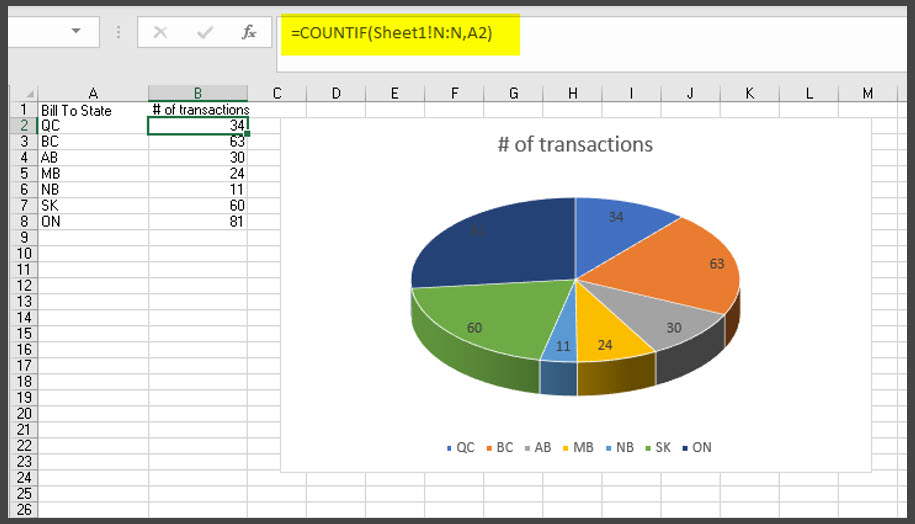
Below is a simple example of how you can use a COUNTIF formula in Excel to create table data that sums the number of transactions by Province or State. This summarizes nicely, and you can chart it as seen below. In the example below, we have selected all the data in Column N on Sheet1 (which is Bill to State) and asked Excel to count the total units based on the State in Cell A2.
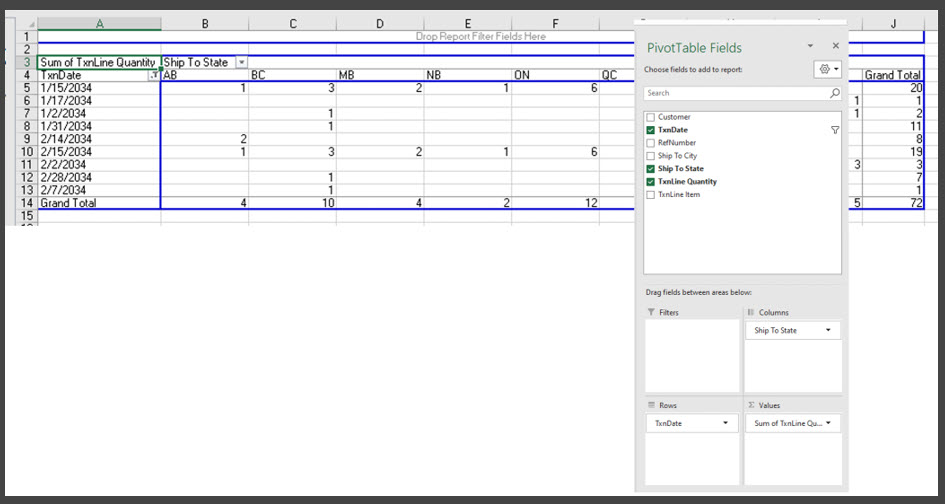
We can also make use of Pivot tables in Excel. By selecting the data ranges in your raw data worksheet, you can select the columns and rows to create highly informative pivot tables to analyze Sales by Province or State by Date.
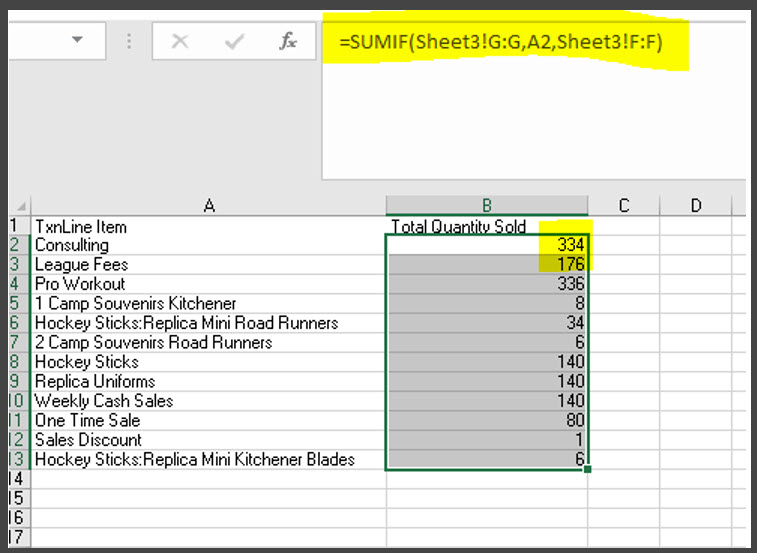
We can also create our summary reports using basic Excel formulas such as SUMIF to calculate total quantities by Inventory product or service. In the SUMIF formula below we asked Excel to Sum all the quantities in Column F in Sheet3 and to calculate it based on the value from cell A2 and lookup all A2 items in Column G in Sheet3. We then copied this formula to all the item lines in this report.
Other uses of exported data would include:
1. Exporting transactions from one QuickBooks database to another database
2. Using data from QuickBooks for data conversion to other systems
3. Exporting to archive transactions
4. Exchanging data with customers and vendors to avoid duplicate entries
5. Sending data to other partners for further analysis
As you can see in all these examples, we can analyze and report on exported data from Transaction Pro Export Utility with extraordinarily little effort or Excel skills. All you need is a desire to do this and a little imagination to make this possible. Now it is your turn to see what you can do with all these tips.